
Australian Sports Retail

Paid Ads : Google Ads

We took on the Google Ads account of an Australian online sports retailer at the point where it had stopped working altogether. Every product in the catalogue had been disapproved, the advertising account was close to being suspended, and fifteen months of spending had gone through a measurement setup that could not report a single reliable sale. We fixed the foundation first, rebuilt the advertising on top of it, and then spent seven months making it cheaper to win a customer.

19x the Visitors, 6x as Likely to Buy

What Happens When You Fix the Measurement First

Advertising cannot be improved while it is being judged by a number that is wrong. This account had spent fifteen months buying clicks it could not connect to sales, for products that were not allowed to appear. We rebuilt the foundation before touching a single campaign.

Across the same three months a year apart, that rebuild produced:

  • Visitors from Google Ads: 279 to 5,256 (up 1,784%, or nearly 19x as many people arriving at the store from the advertising)
  • Conversion rate: 0.93% to 5.50% (up 491%, or nearly 6x as many of those visitors going on to buy something)
  • Return on ad spend: 5.23x (for every dollar spent on advertising, $5.23 came back as sales)

More traffic on its own is easy to buy. More traffic that converts six times better is the part that had to be earned.

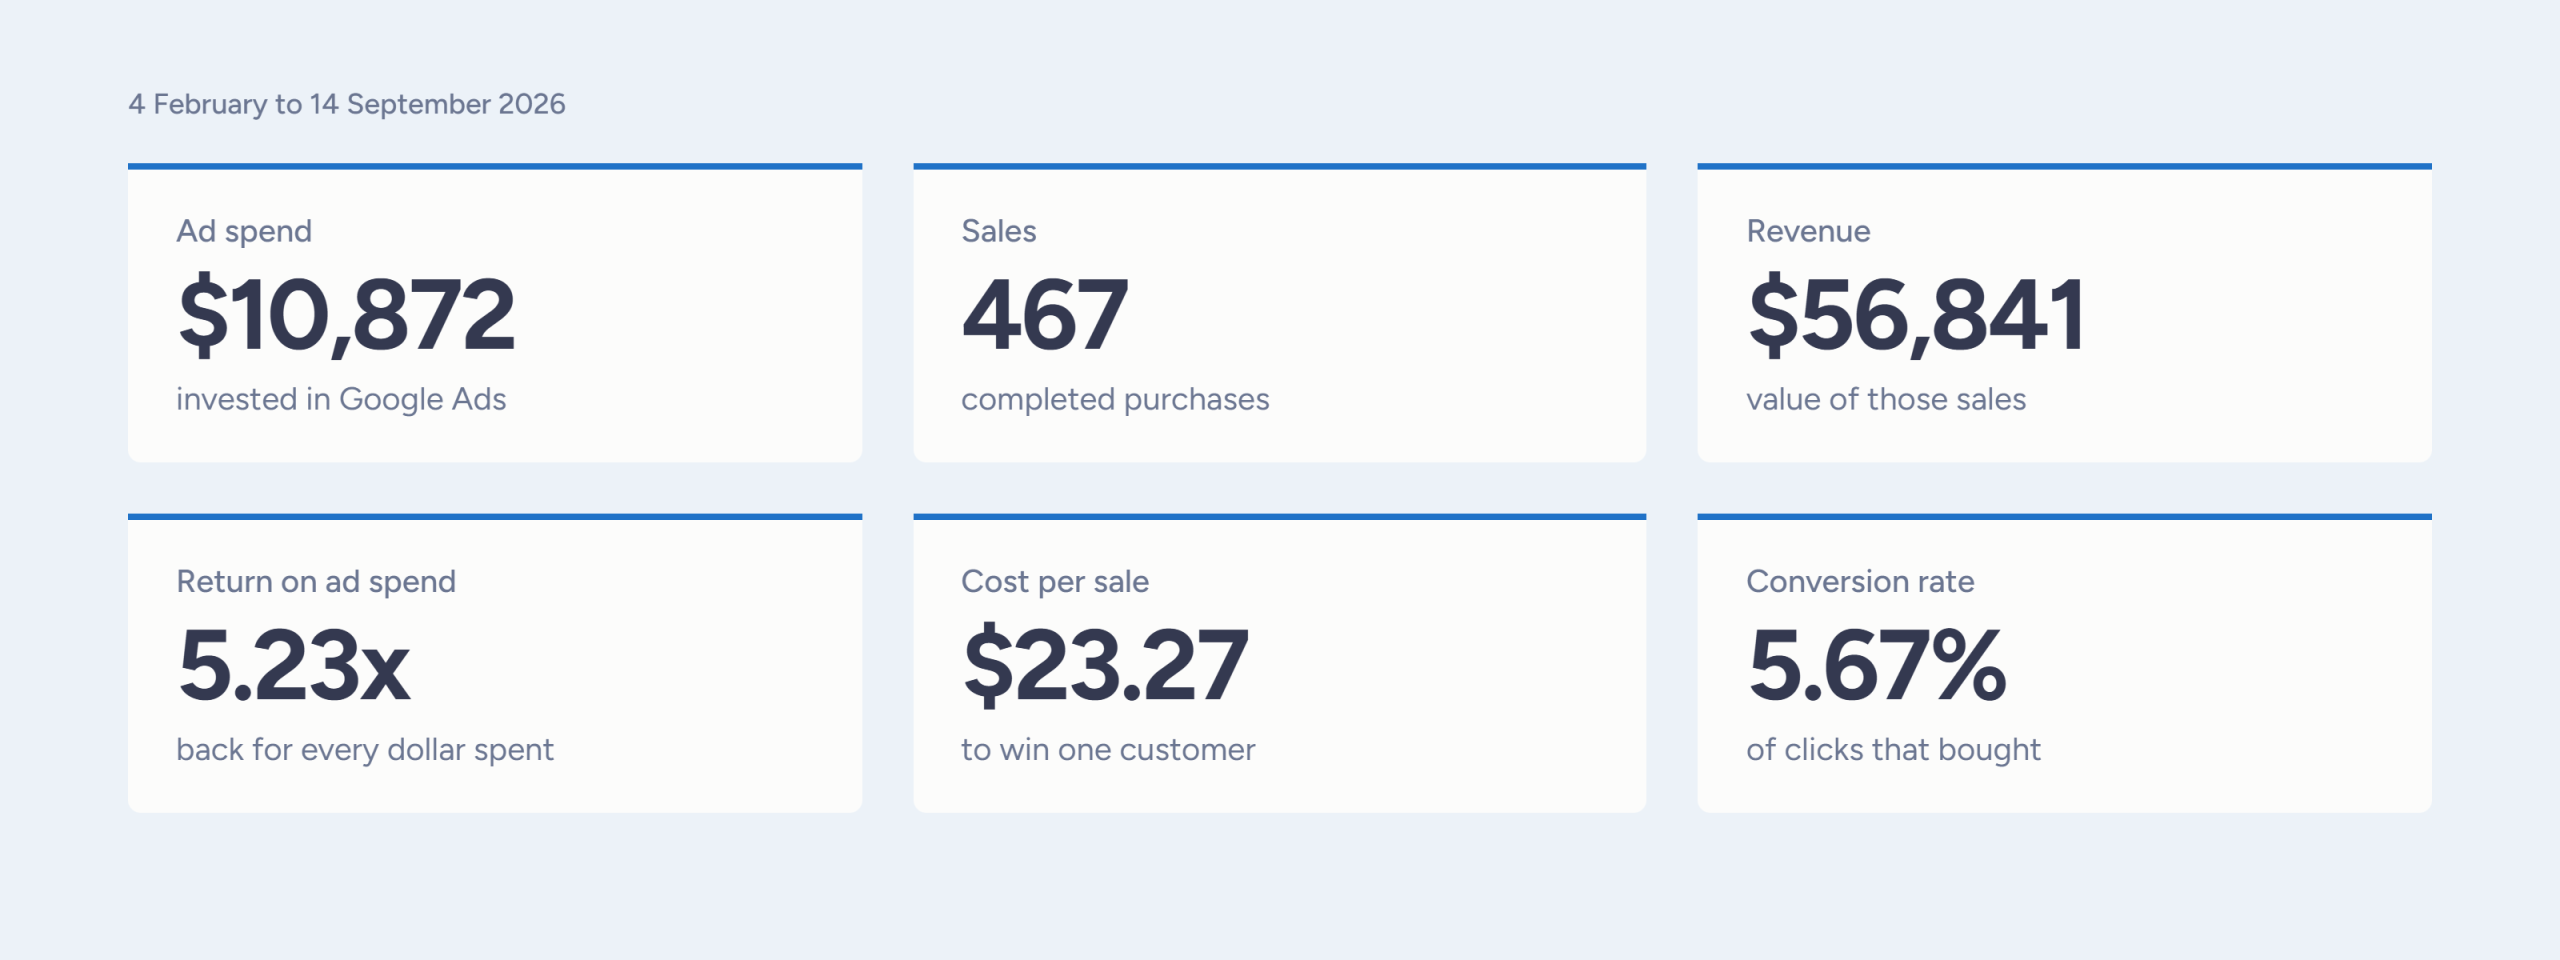
Google Ads performance summary for an Australian sports retailer: $10,872 spend, 467 sales, $56,841 revenue, 5.23x return on ad spend

Client

The client is an Australian direct-to-consumer sports retailer, trading online and selling to fans rather than clubs. A small owner-operated team running the whole business themselves, with the marketing sitting on top of everything else they already had to do.

Two things shape how advertising has to work for a business like this. Demand is seasonal and spikes hard around major sporting events, so a campaign that is set and forgotten will badly under-serve the peak and over-serve the quiet weeks. And on a modest monthly budget there is no room to buy your way out of a mistake. Every dollar has to be pointed at someone who is actually going to buy.

The Problem

This did not start as an advertising job. It started as a rescue. When we reviewed the account, the advertising was not underperforming. It was not functioning.

  • Every product disapproved: the product feed had been set up to sell into 17 international markets while the shop could only serve two. That produced wrong currencies, wrong product data and a stack of policy breaches, ending with the entire catalogue disapproved and the account at genuine risk of suspension. A store that cannot show its products cannot sell anything, at any budget.
  • Conversion tracking that had never worked: the advertising platform and the analytics platform were half connected, with the tagging that carries data between them either missing or wrong. It had been that way for over a year.
  • Sales counted, but never valued: seven of the account’s nine campaigns were recording every conversion as being worth exactly one dollar. That is the signature of something being counted with no sale value attached to it.
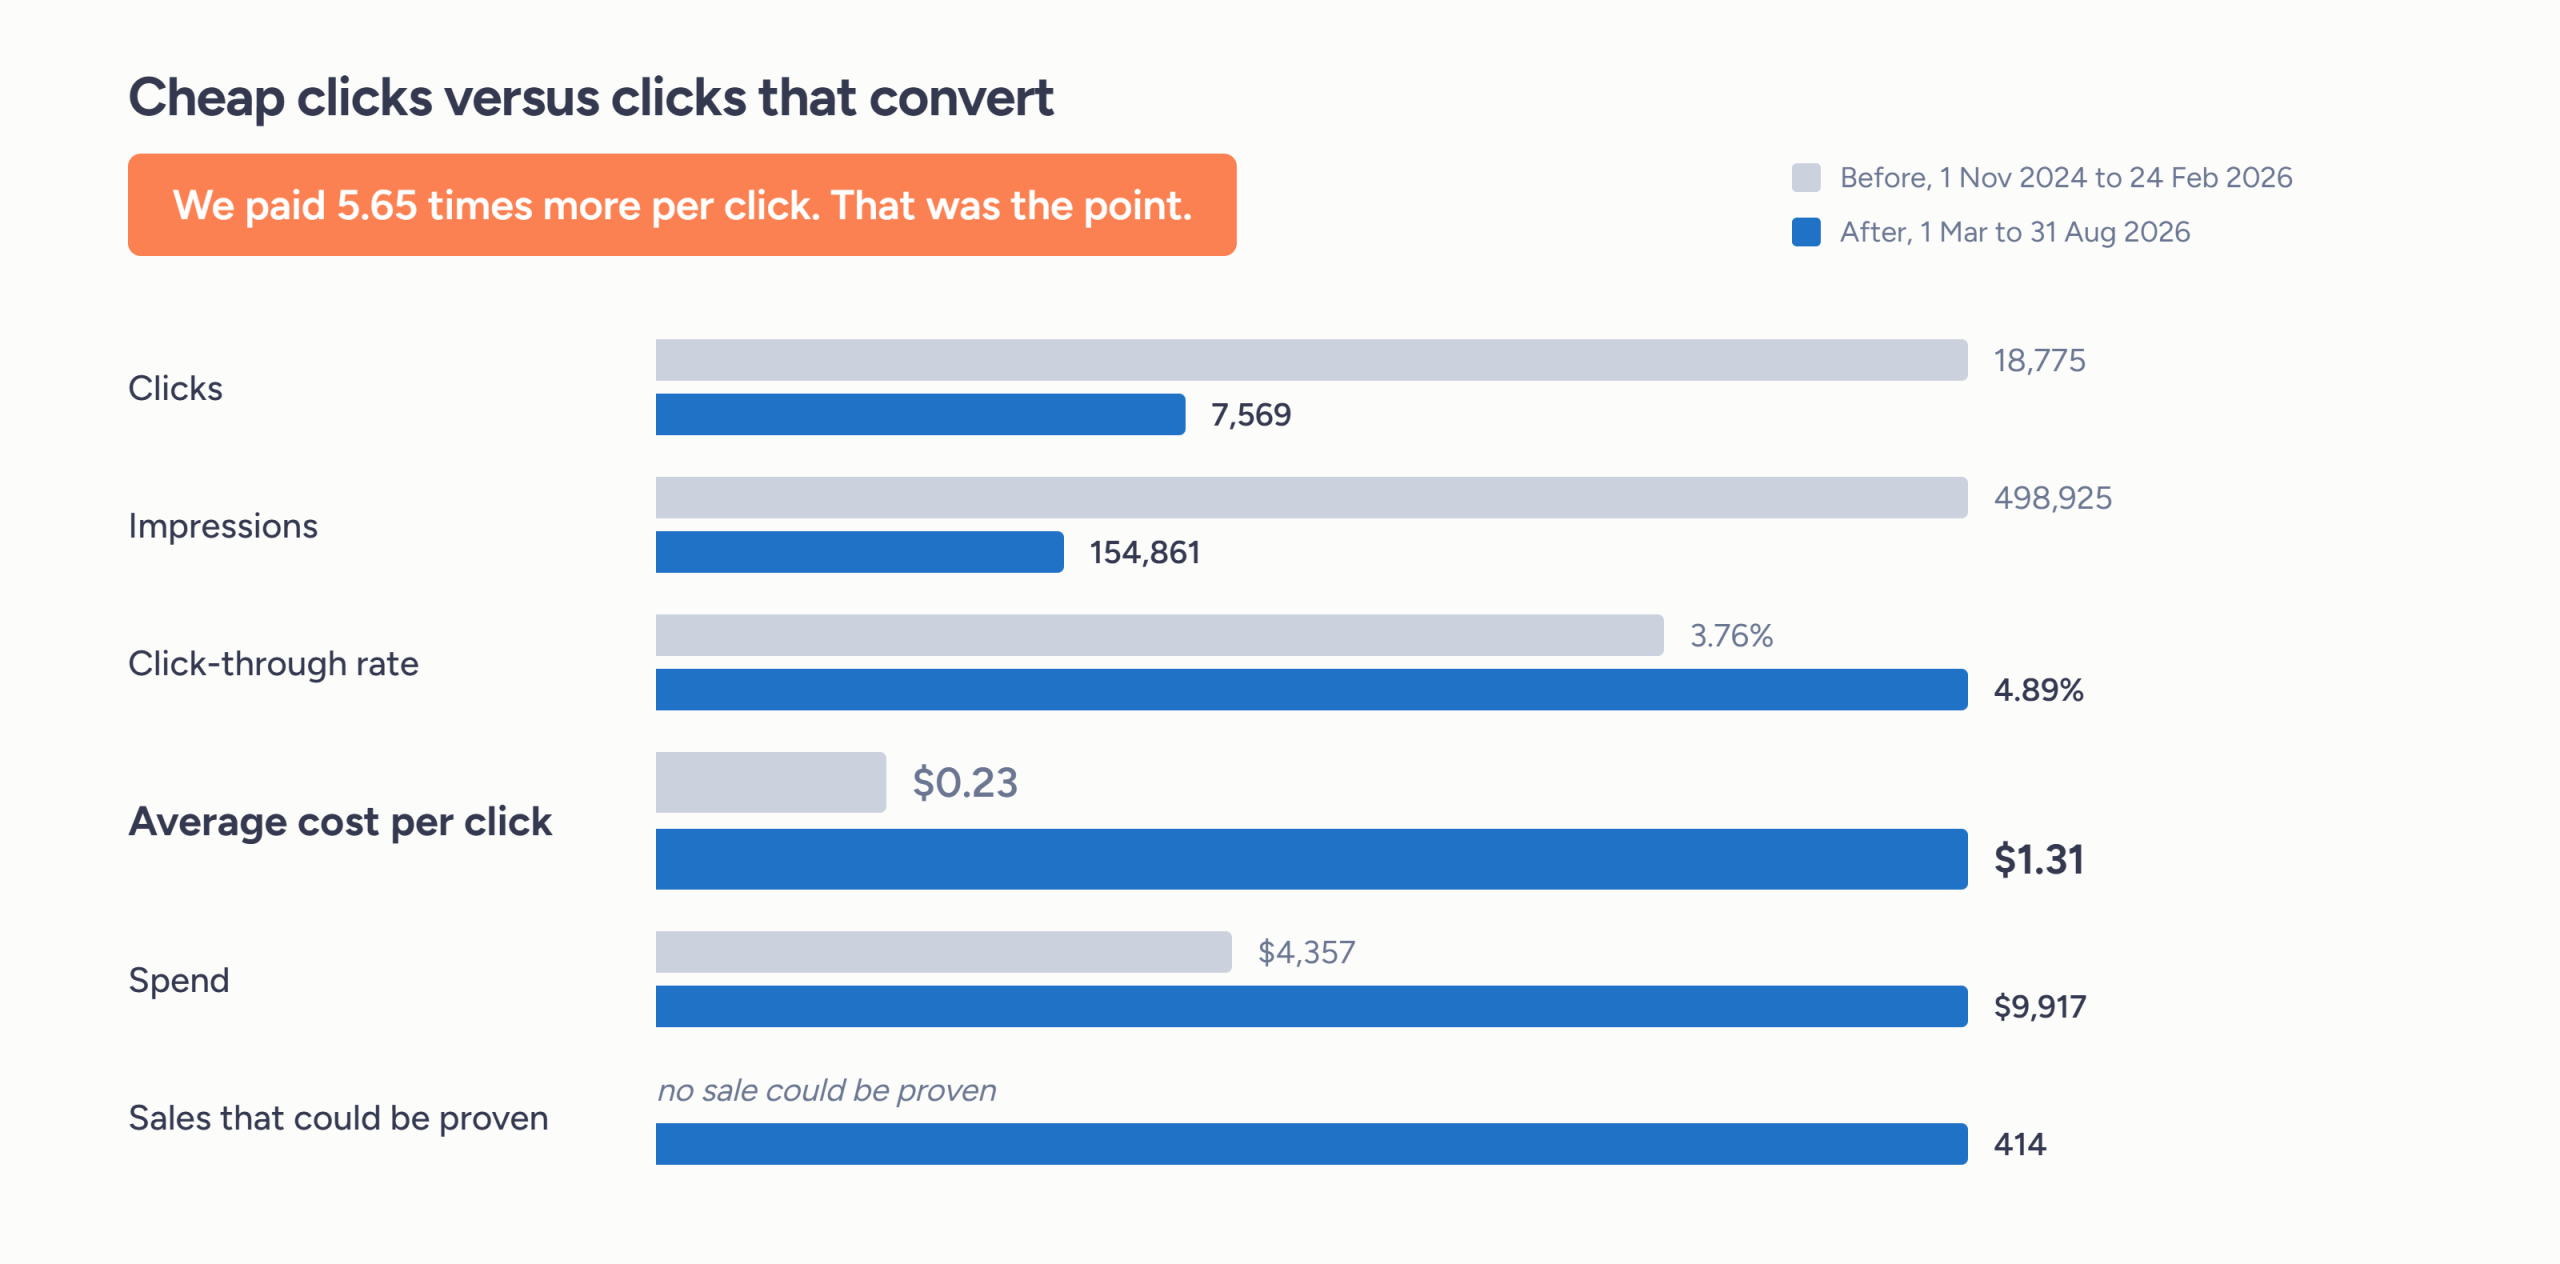
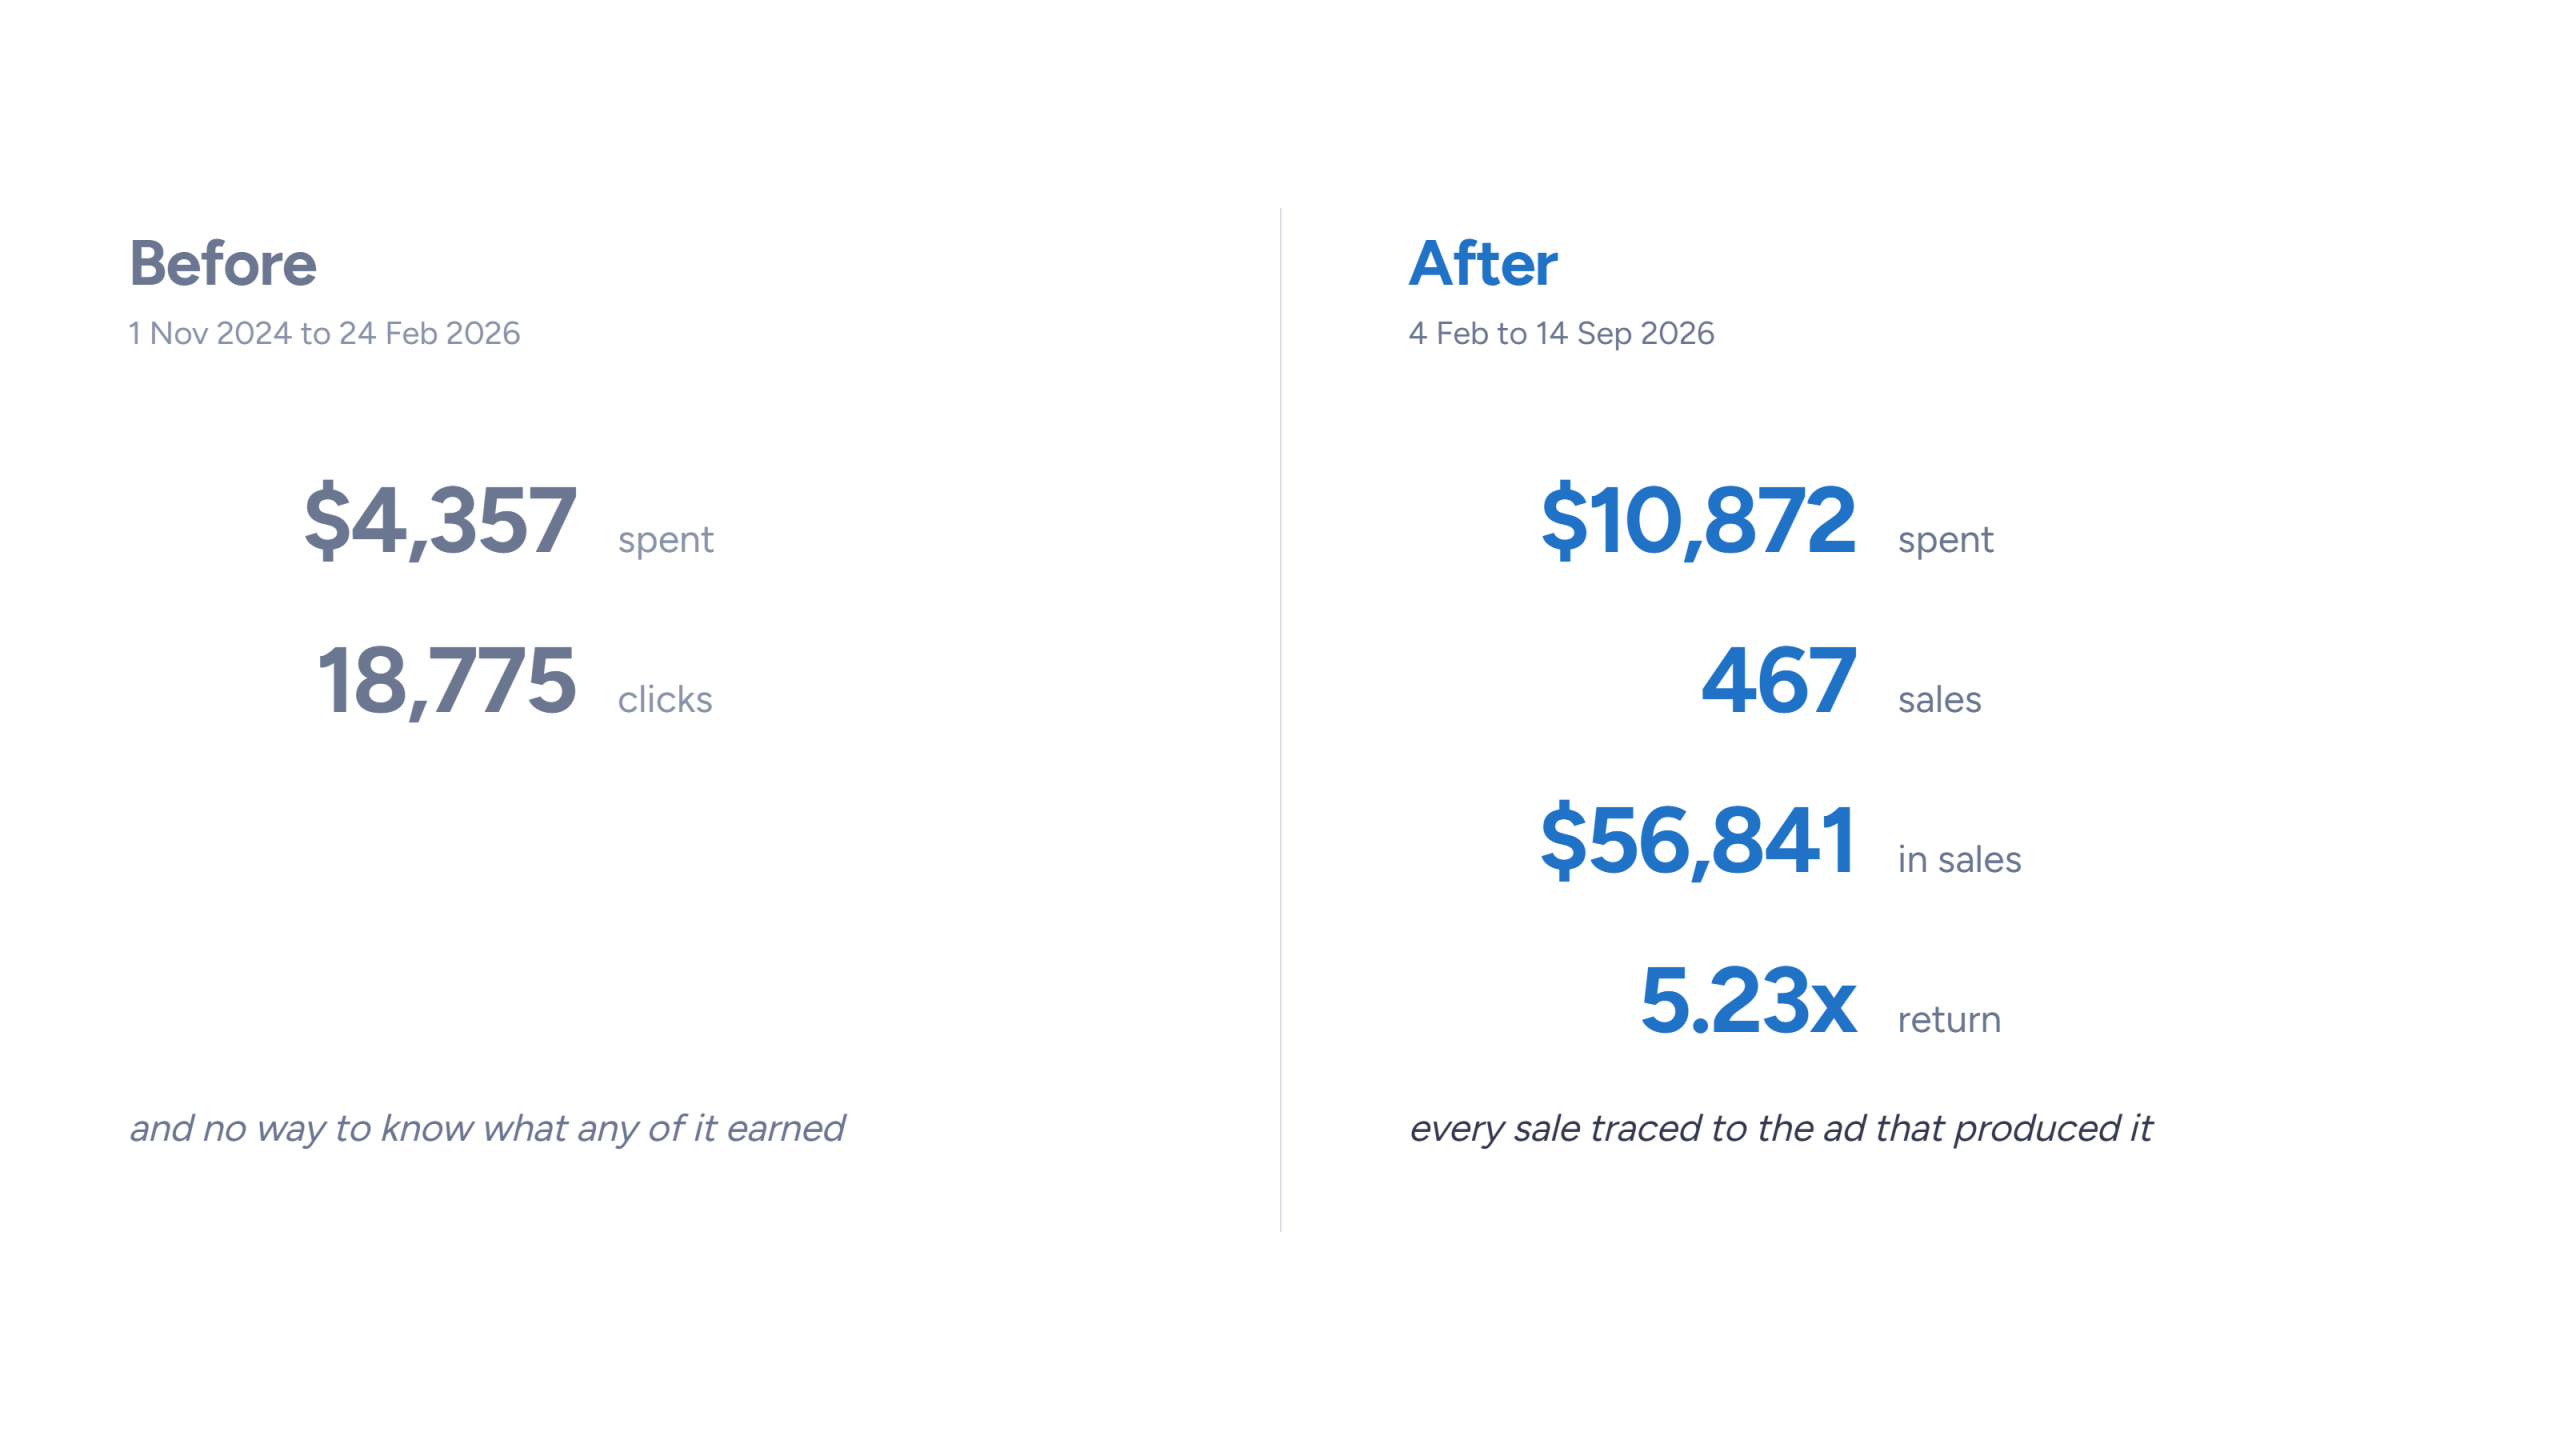
  • Fifteen months of unjudgeable spend: the account had spent $4,357 and bought 18,775 clicks, and could not tell anyone what a single dollar of it had earned. The business had been buying advertising it had no way to assess.
  • The platform making its own decisions: automated recommendations had been left switched on and had been quietly changing the account’s settings, including how it bid and which outcomes it treated as valuable. Nobody had decided any of that.

Our Approach

We did not touch the advertising first. Improving a campaign that is judged by a number it cannot see, for products that are not allowed to appear, only gets you to the wrong place faster.

  • Foundation before advertising: the repair was the work, and it’s the half nobody puts on a results chart. Feeds were restructured down to the markets the store can actually serve, the connection between shop and ad account reinstalled from scratch, and every product restored and approved.
  • Conversion tracking rebuilt end to end: rebuilt across the whole stack so that a completed purchase, and only a completed purchase, counted as a result. A sale in the shop and a sale in the reporting finally became the same event.
  • Automation switched off, settings restored: the recommendations that had been changing settings on their own were turned off, and everything they had altered was put back to what the business actually wanted.
  • Timed around the platform migration: the business was moving to a new platform mid-project. Rebuilding tracking on the old site would have meant building it twice and getting it wrong once, so we waited for the new site and installed the corrected structure once, properly.
  • Brand and non-brand separated: people searching for the store by name were always going to find it, and every one of those clicks was either ours cheaply or a competitor’s for free. Handling them separately let us defend the brand and, at the same time, judge the main campaign on the only thing that matters for growth: whether it can find people who have never heard of this shop.
  • A deliberate quiet month: the month after the rebuild, we did almost nothing beyond reviewing searches and checking the numbers lined up with the shop. It grew anyway. An account that only performs while somebody is fiddling with it has not actually been fixed.
  • Restraint as the ongoing discipline: on one review, twelve search terms were put forward for exclusion and eleven were rejected as too close to what the business actually sells. On another, an old exclusion was found to be blocking an entire product theme the business had since decided to push, and it was removed. It is easy to cut spending and call it optimisation. It is harder, and worth more, to leave a term running because you understand why it converts.
iSonic services: paid ads, SEO, web design, marketing, content and hosting

The Results

Everything below is measured in the rebuilt account from February to September 2026, and every monthly figure is one the client was given at the time.

  • Advertising spend: $10,872 (what the business invested in Google Ads across the seven months)
  • Sales: 467 (completed purchases, each one traceable back to the advertising that produced it)
  • Revenue from advertising: $56,841 (the value of those sales, as recorded in the ad account and independently confirmed in the client’s own shop data)
  • Return on ad spend: 5.23x (five dollars and twenty-three cents of sales for every dollar of advertising)
  • Cost per sale: $23.27 (what it cost, on average, to win one customer)
  • Conversion rate: 5.67 per cent (the share of people who clicked an ad and went on to buy)
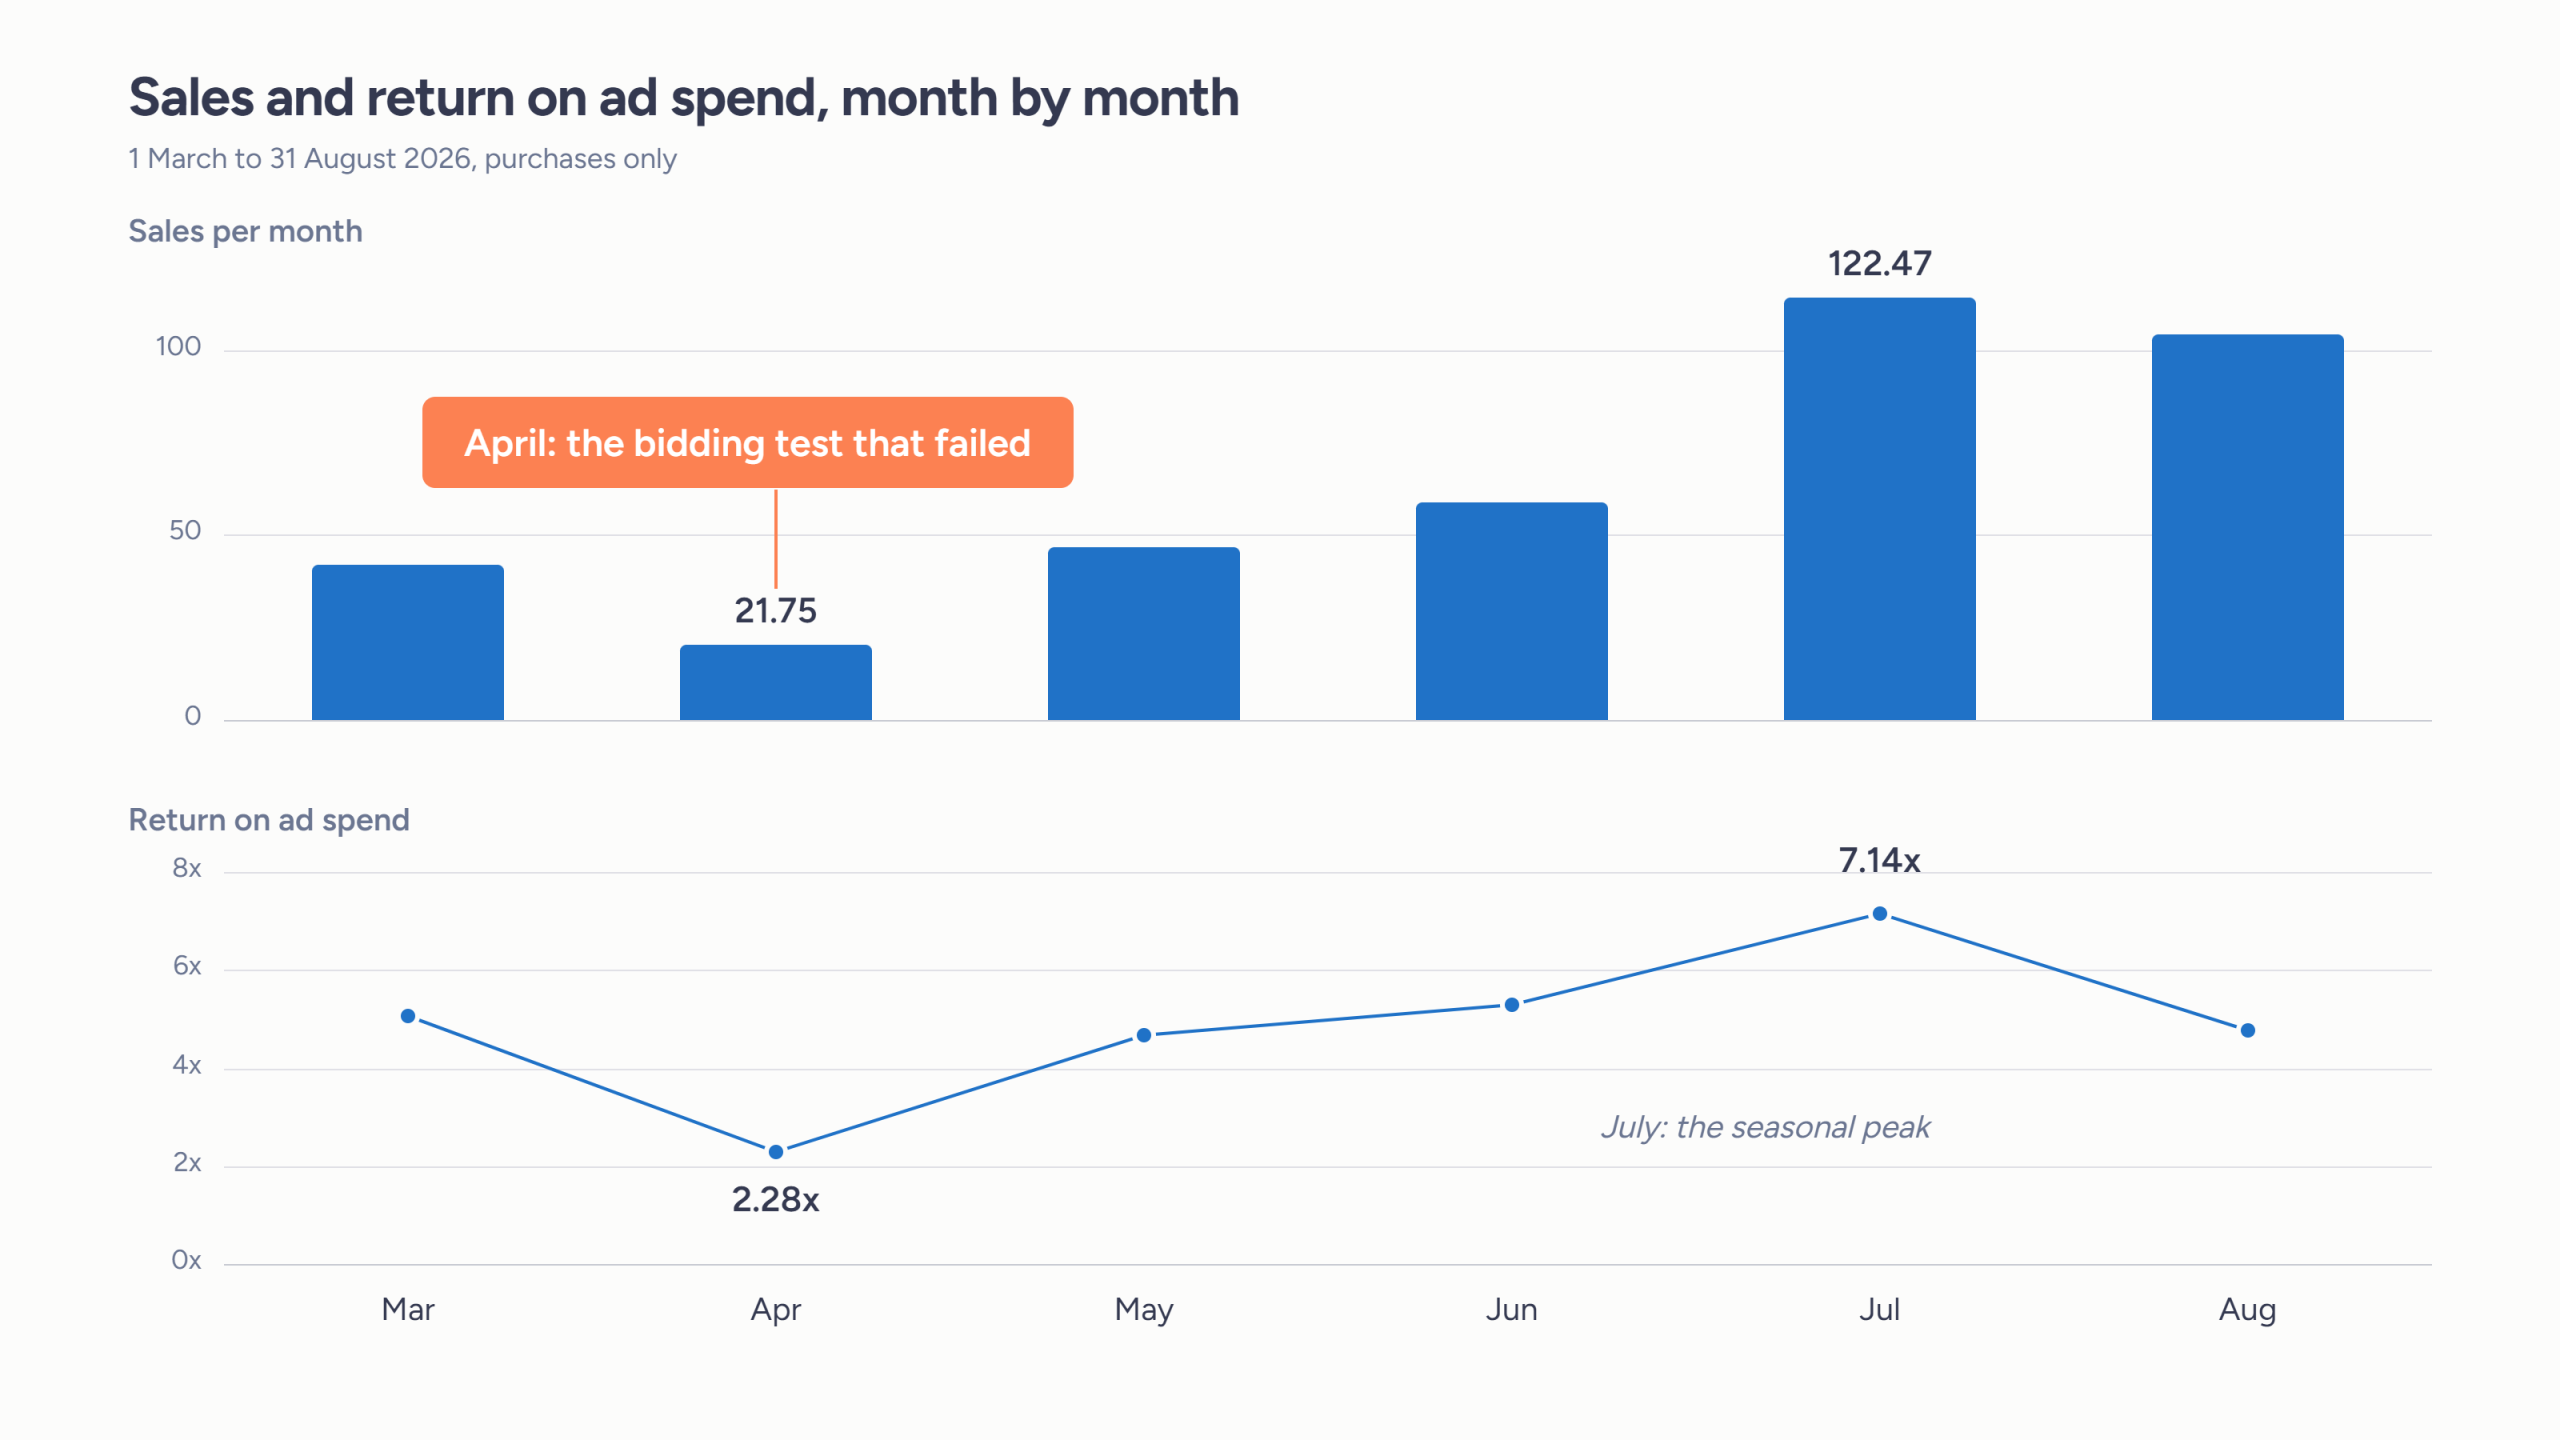
Monthly Google Ads sales and return on ad spend, March to August 2026, peaking at 7.14x in July

Nine in ten of those buyers had never bought from the store before. Confirmed in the client’s own shop data rather than claimed from our reporting. The advertising was not just collecting people who were coming anyway, it was bringing new customers to the business.

The cost of winning a customer fell by nearly 60 per cent. In April, the worst month of the engagement, a sale cost $46.26. By July it cost $19.26. Same account, same products, same market.

More of the people arriving actually bought. The share of visitors who purchased rose from 4.2 per cent to 7.9 per cent across the second half of the engagement, an improvement of 88 per cent, and the best figure came in the month after the seasonal peak rather than during it.

The measurement rebuild was proved, not assumed. Across a three-month window, the advertising platform reported $31,353 of revenue and the client’s own shop reported $31,147 from the same source. An attribution difference of only 0.7%. After a year of numbers nobody could rely on, the two systems finally agreed.

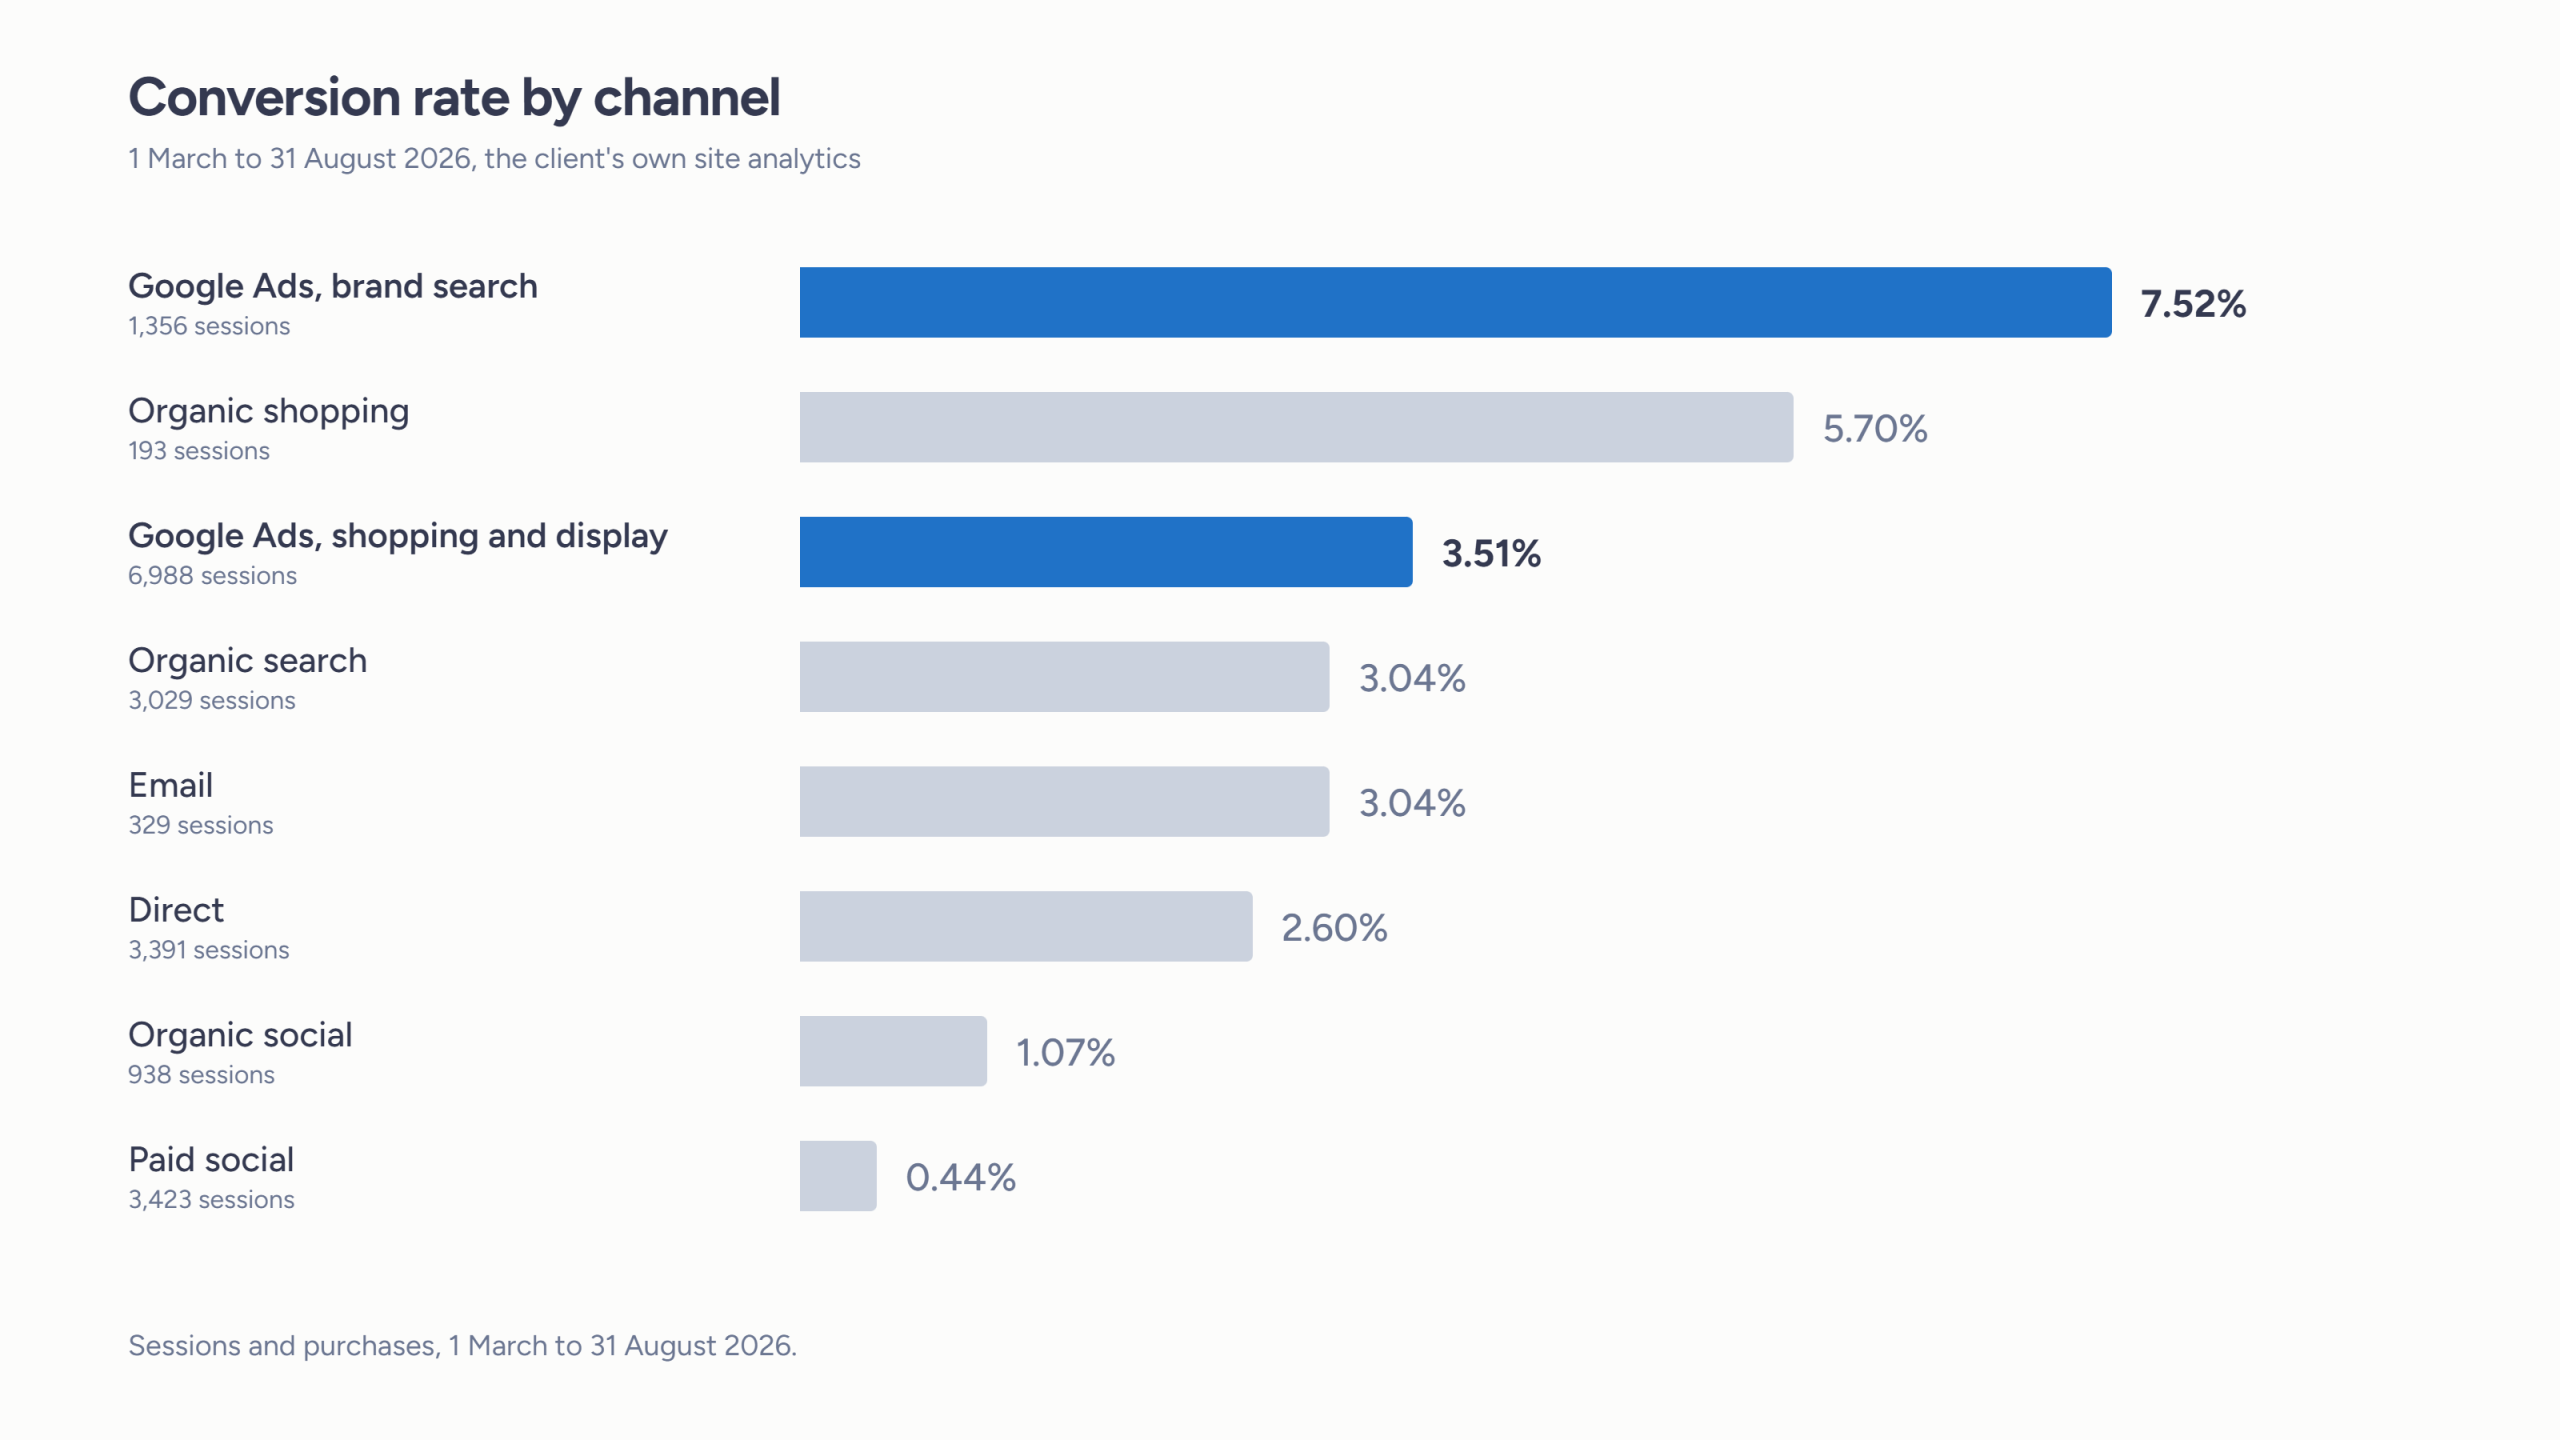
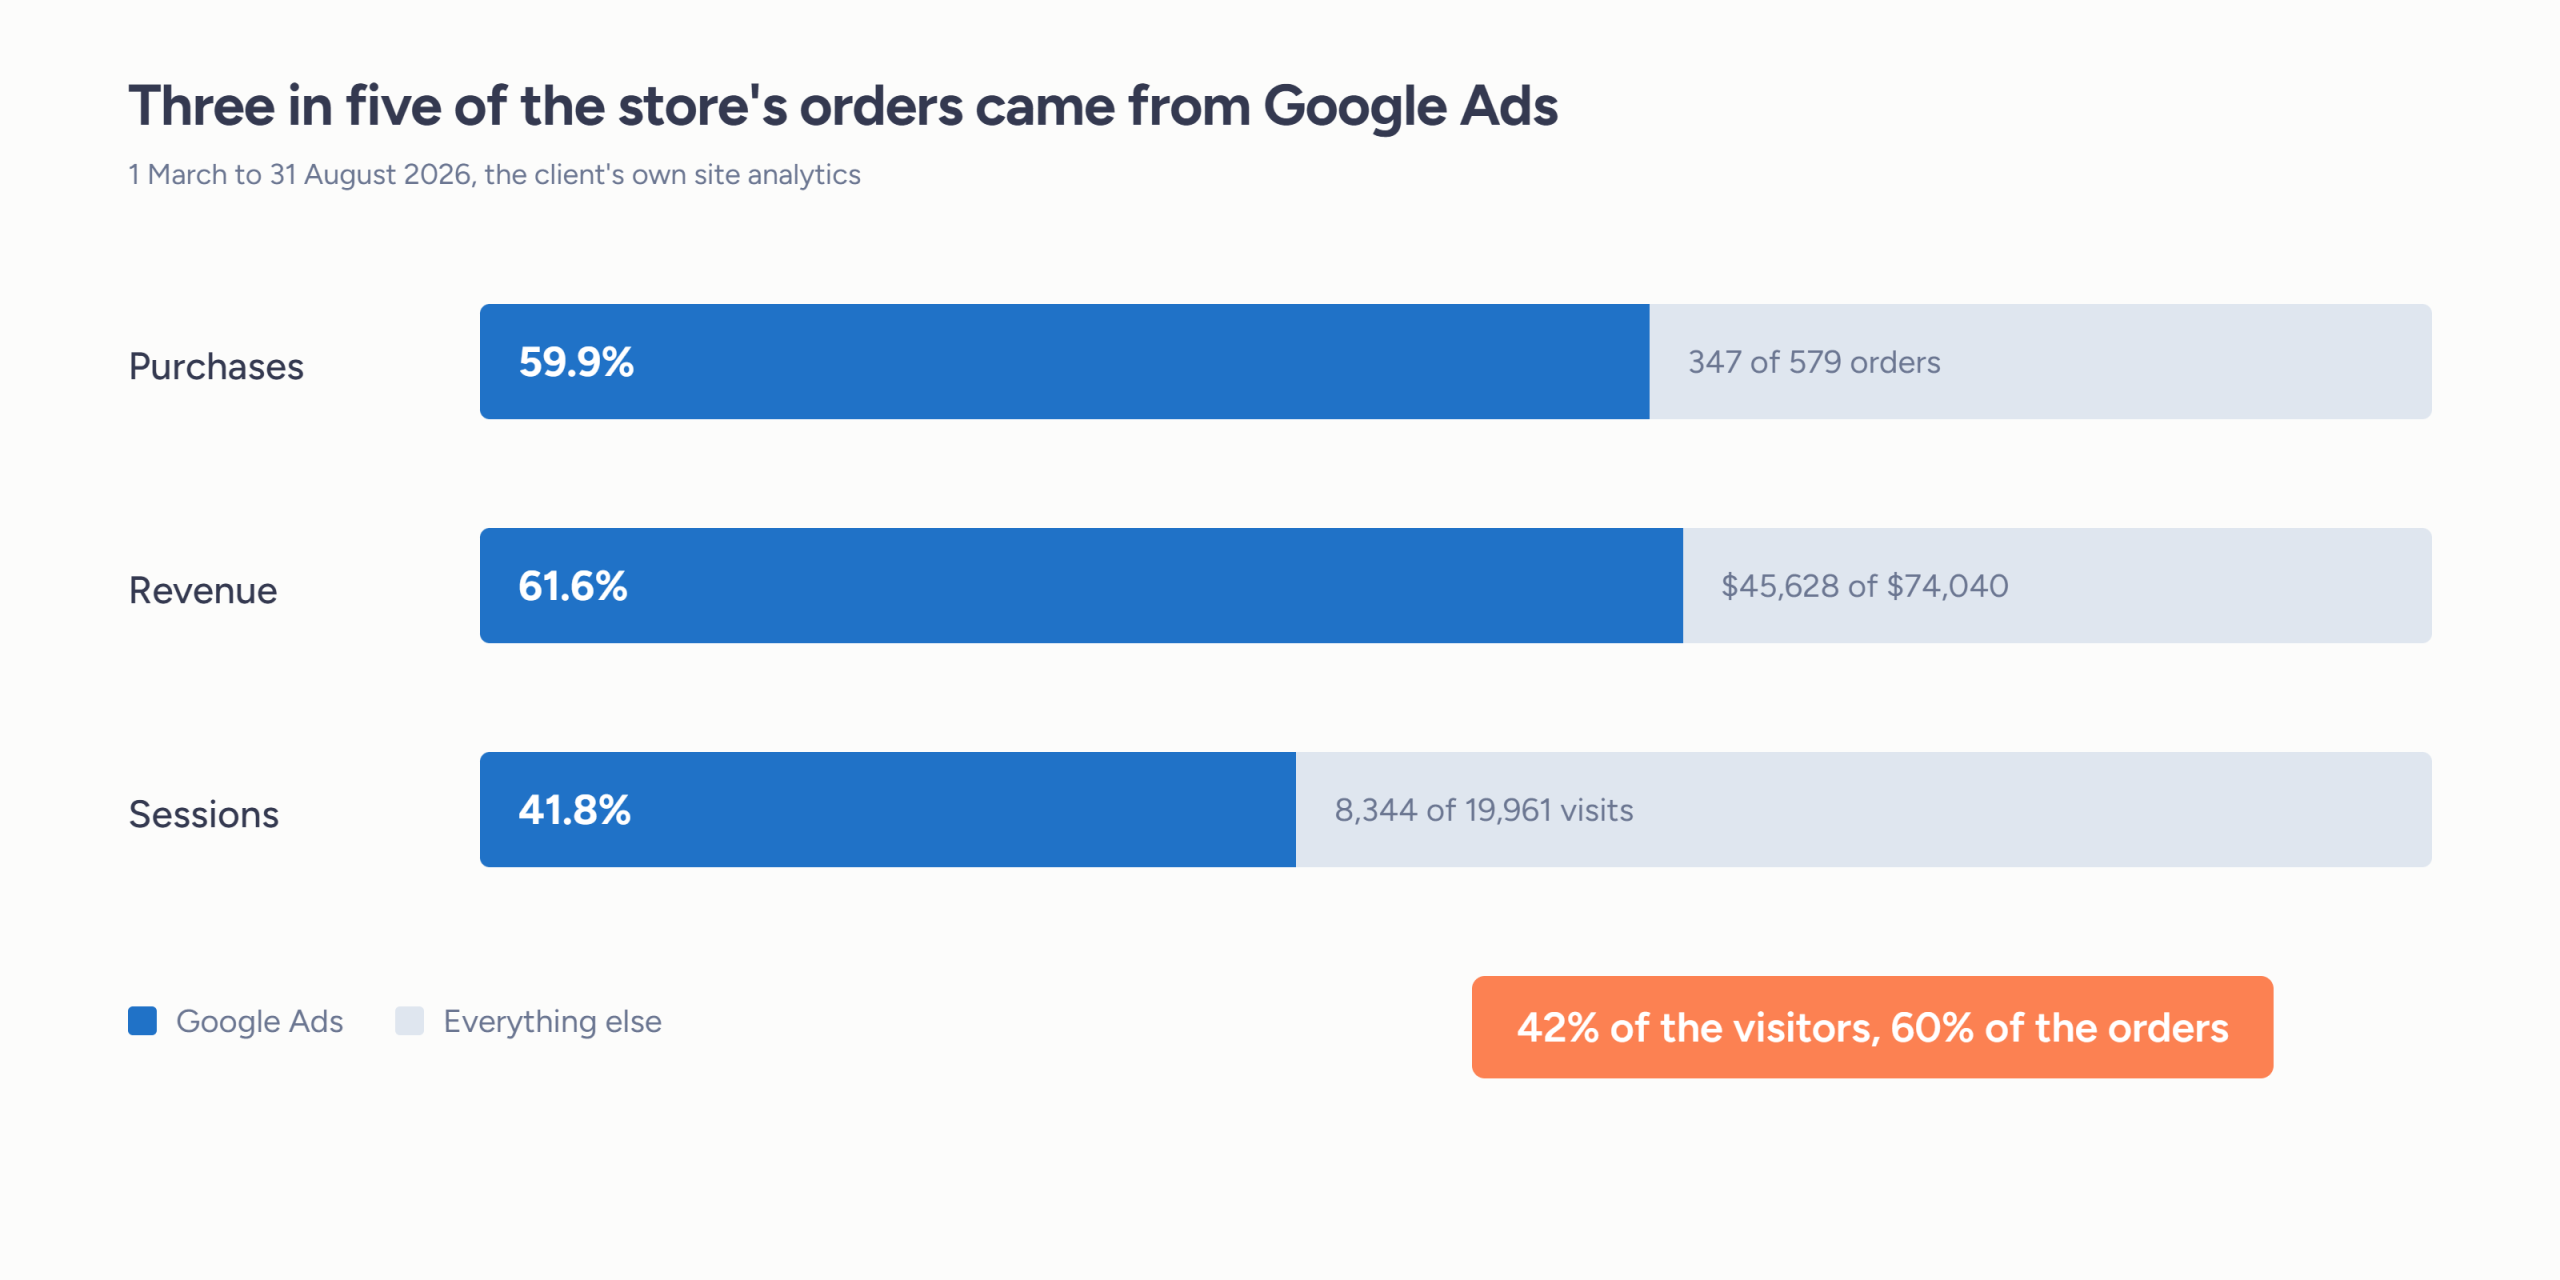
It was also the best-converting channel on the site. Google Ads brand search converted at 7.52% and the main shopping campaign at 3.51%, against 3.04% for organic search, 2.60% for direct and 0.44% for paid social. Google Ads supplied 41.8% of the store’s visits and produced 59.9% of its orders.

The seasonal peak lifted the floor rather than renting it. During a major sporting event we increased spend by 29% and revenue rose 88%, with return on ad spend improving from 4.57x to 6.68x and the cost of a sale falling from $32.37 to $22.93. The real test came afterwards. Spikes like that normally collapse the week the event ends. This one did not: the months that followed settled well above the pre-event baseline rather than back down to it.
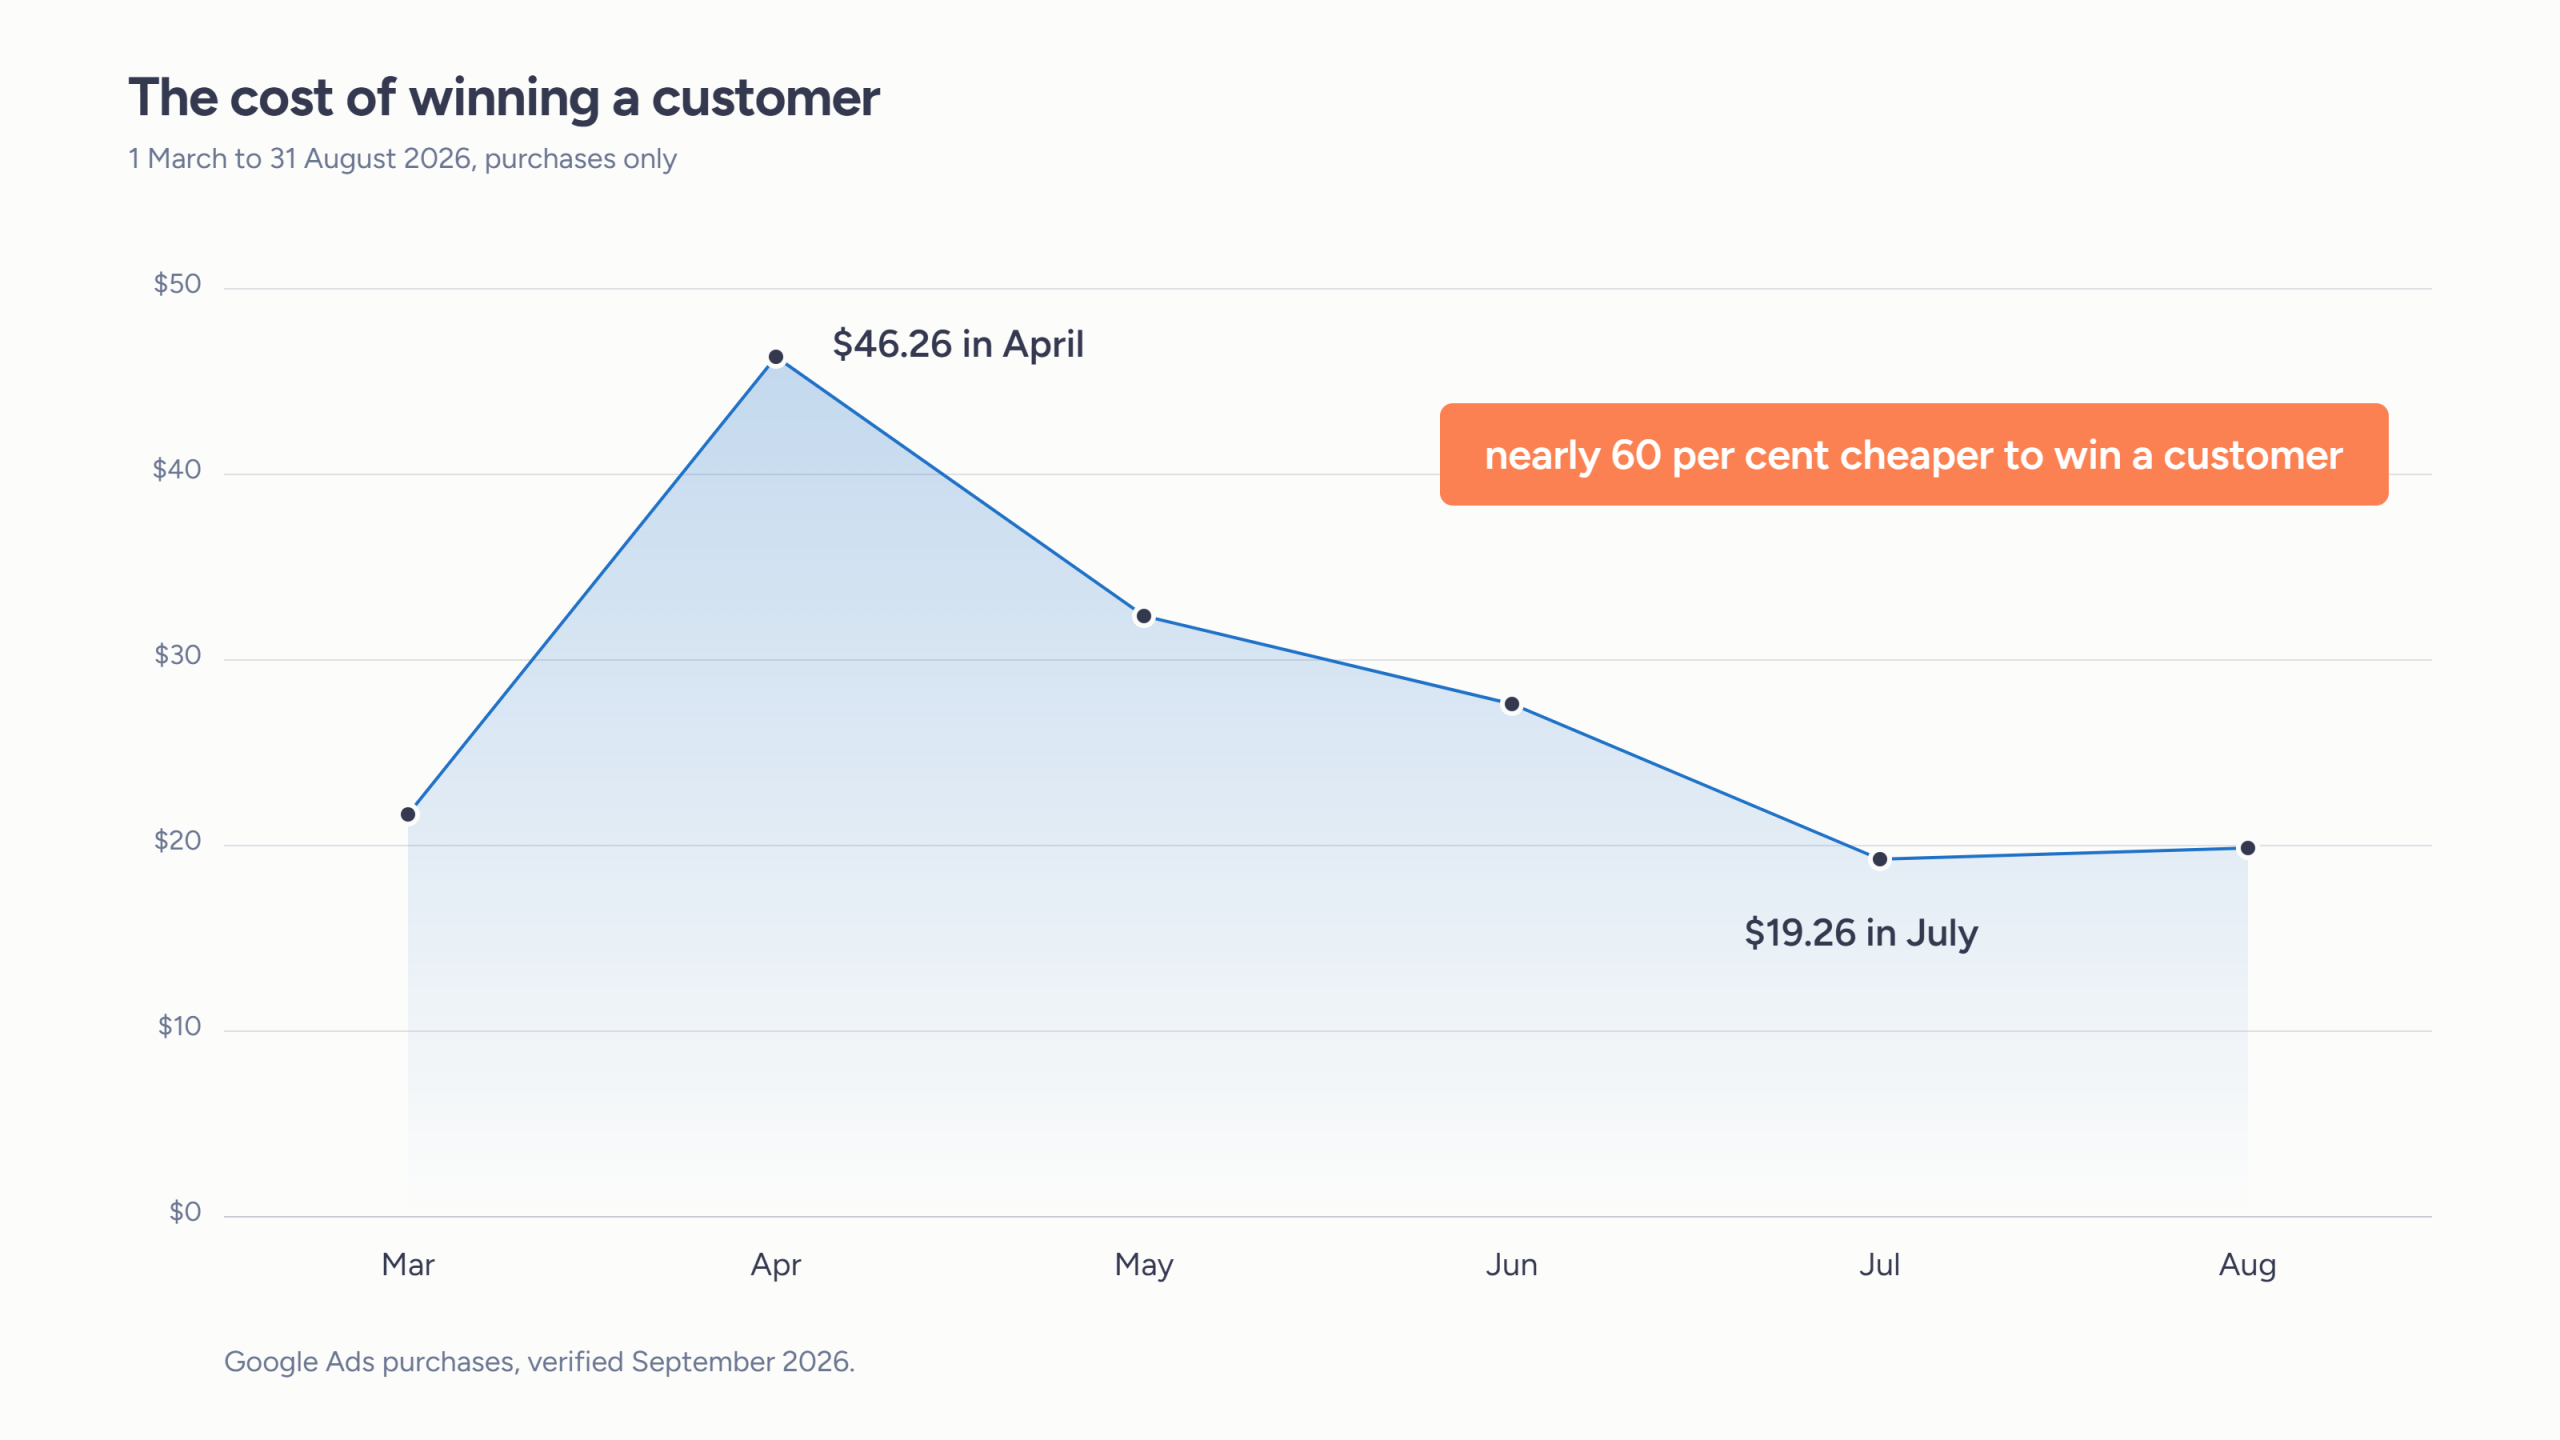

Google Ads cost per sale falling from $46.26 in April to $19.26 in July 2026

Key Takeaways

  • Fix the measurement before you optimise anything: an account judged by a number it cannot see will be optimised towards the wrong outcome, faster. The repair is invisible on a results chart and it’s the reason the chart exists at all.
  • A test that fails is still worth running: we tested a different way of bidding, aimed at the value of each order rather than the number of them. Sales halved, the cost of winning one more than doubled, and it became the worst month of the engagement. We reported it as a deliberate test rather than dressing it up, reverted it, and kept what it taught us about how hard the account could be pushed. A month spent learning what doesn’t work is only wasted if you pretend it didn’t happen.
  • Restraint beats activity: advertising platforms prompt you constantly to raise budgets, broaden targeting and hand back control. Most of those prompts are built to increase spend rather than profit. Judging each one against the account’s own numbers, and declining the ones that fail, is worth more than being seen to be busy.
  • Say where the ceiling is: by the middle of the engagement the core search demand for this product was close to saturated, and more budget alone was not going to solve it. We said so directly, in a strategy session, rather than letting the client discover it three months later. Advertising can capture demand that exists. Creating more of it is a different job, and pretending otherwise would have been the easier sale.    
  • Forecast the bad month too: the report written at the peak told the client in plain terms that the following month would settle back, and that this would not be a sign of anything going wrong. It did, and it was not. Being right about the bad month matters more than being pleased about the good one.
Before and after comparison: $4,357 of unmeasurable ad spend against $10,872 returning 467 traceable sales
Google Ads produced 59.9 per cent of the store's orders and 61.6 per cent of its revenue from 41.8 per cent of its visits

Want to Grow Smarter with Google Ads?

iSonic Digital helps online stores get their advertising onto a foundation they can actually trust, then grows it against numbers that hold up. Whether your account needs rescuing, rebuilding or simply scaling with more discipline, we bring the strategy and execution to make every dollar of ad spend accountable.

Get in touch to see how we can help your store grow profitably.